

Based on a lot of useful references especially (https://gist.github.com/neale/e32b1f16a43bfdc0608f45a504df5a84) here I share my code to plot the animated trajectory of a particle (in this case electron) using a 3D line/scatter chart.
In my last two blog posts I have already shown how to create an animated 2D line/scatter plot and how to plot a 3D chart.
Here we combine the two codes.
If you just want a line chart then use the following:
CODE
import numpy as np
import matplotlib.pyplot as plt
import matplotlib.animation as animation
from mpl_toolkits.mplot3d import Axes3D
# References
# https://gist.github.com/neale/e32b1f16a43bfdc0608f45a504df5a84
# https://towardsdatascience.com/animations-with-matplotlib-d96375c5442c
# https://riptutorial.com/matplotlib/example/23558/basic-animation-with-funcanimation
# ANIMATION FUNCTION
def func(num, dataSet, line):
# NOTE: there is no .set_data() for 3 dim data...
line.set_data(dataSet[0:2, :num])
line.set_3d_properties(dataSet[2, :num])
return line
# THE DATA POINTS
t = np.arange(0,20,0.2) # This would be the z-axis ('t' means time here)
x = np.cos(t)-1
y = 1/2*(np.cos(2*t)-1)
dataSet = np.array([x, y, t])
numDataPoints = len(t)
# GET SOME MATPLOTLIB OBJECTS
fig = plt.figure()
ax = Axes3D(fig)
# NOTE: Can't pass empty arrays into 3d version of plot()
line = plt.plot(dataSet[0], dataSet[1], dataSet[2], lw=2, c='g')[0] # For line plot
# AXES PROPERTIES]
# ax.set_xlim3d([limit0, limit1])
ax.set_xlabel('X(t)')
ax.set_ylabel('Y(t)')
ax.set_zlabel('time')
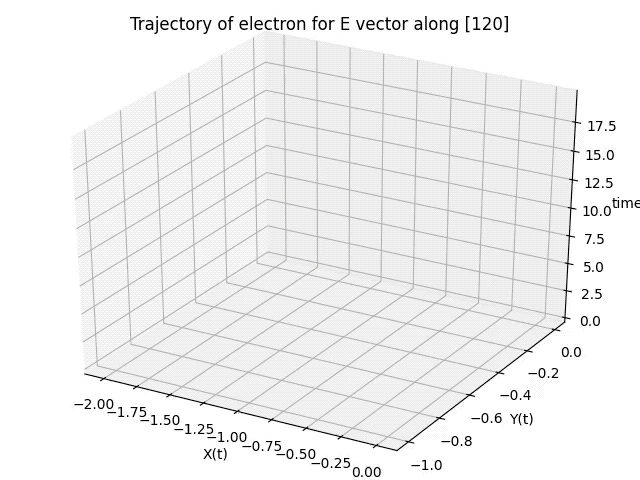
ax.set_title('Trajectory of electron for E vector along [120]')
# Creating the Animation object
line_ani = animation.FuncAnimation(fig, func, frames=numDataPoints, fargs=(dataSet,line), interval=50, blit=False)
#line_ani.save(r'AnimationNew.mp4')
plt.show()
OUTPUT

For a combination of Scatter and Line chart use the following code
CODE
import numpy as np
import matplotlib.pyplot as plt
import matplotlib.animation as animation
from mpl_toolkits.mplot3d import Axes3D

# References
# https://gist.github.com/neale/e32b1f16a43bfdc0608f45a504df5a84
# https://towardsdatascience.com/animations-with-matplotlib-d96375c5442c
# https://riptutorial.com/matplotlib/example/23558/basic-animation-with-funcanimation

# ANIMATION FUNCTION
def func(num, dataSet, line, redDots):
    # NOTE: there is no .set_data() for 3 dim data...
    line.set_data(dataSet[0:2, :num])
    line.set_3d_properties(dataSet[2, :num])
    redDots.set_data(dataSet[0:2, :num])
    redDots.set_3d_properties(dataSet[2, :num])
    return line


# THE DATA POINTS
t = np.arange(0,20,0.2) # This would be the z-axis ('t' means time here)
x = np.cos(t)-1
y = 1/2*(np.cos(2*t)-1)
dataSet = np.array([x, y, t])
numDataPoints = len(t)

# GET SOME MATPLOTLIB OBJECTS
fig = plt.figure()
ax = Axes3D(fig)
redDots = plt.plot(dataSet[0], dataSet[1], dataSet[2], lw=2, c='r', marker='o')[0] # For scatter plot
# NOTE: Can't pass empty arrays into 3d version of plot()
line = plt.plot(dataSet[0], dataSet[1], dataSet[2], lw=2, c='g')[0] # For line plot

# AXES PROPERTIES]
# ax.set_xlim3d([limit0, limit1])
ax.set_xlabel('X(t)')
ax.set_ylabel('Y(t)')
ax.set_zlabel('time')
ax.set_title('Trajectory of electron for E vector along [120]')

# Creating the Animation object
line_ani = animation.FuncAnimation(fig, func, frames=numDataPoints, fargs=(dataSet,line,redDots), interval=50, blit=False)
# line_ani.save(r'Animation.mp4')


plt.show()
OUTPUT
I’m a physicist specializing in computational material science with a PhD in Physics from Friedrich-Schiller University Jena, Germany. I write efficient codes for simulating light-matter interactions at atomic scales. I like to develop Physics, DFT, and Machine Learning related apps and software from time to time. Can code in most of the popular languages. I like to share my knowledge in Physics and applications using this Blog and a YouTube channel.
Thank you for making this! On a side note, I visited Jena once and I had some good Indian food there, about 5 years ago. Is there still good Indian food to be eaten there?
Dear Sir,
Great job done by you. Excellent coding. Looking forward for more
codes like these classic works
With Best regards,
Dr. Anathnath Ghosh