
Crystal Structure:
| TiO2 Anatase |
|
About/Help |
CIF Source:
Acta Crystallographica B47 (1991) 462-468
Structural and thermal parameters for rutile and anatase
Locality: synthetic
_database_code_amcsd 0019093
http://rruff.geo.arizona.edu/AMS/CIF_text_files/11272_cif.txt
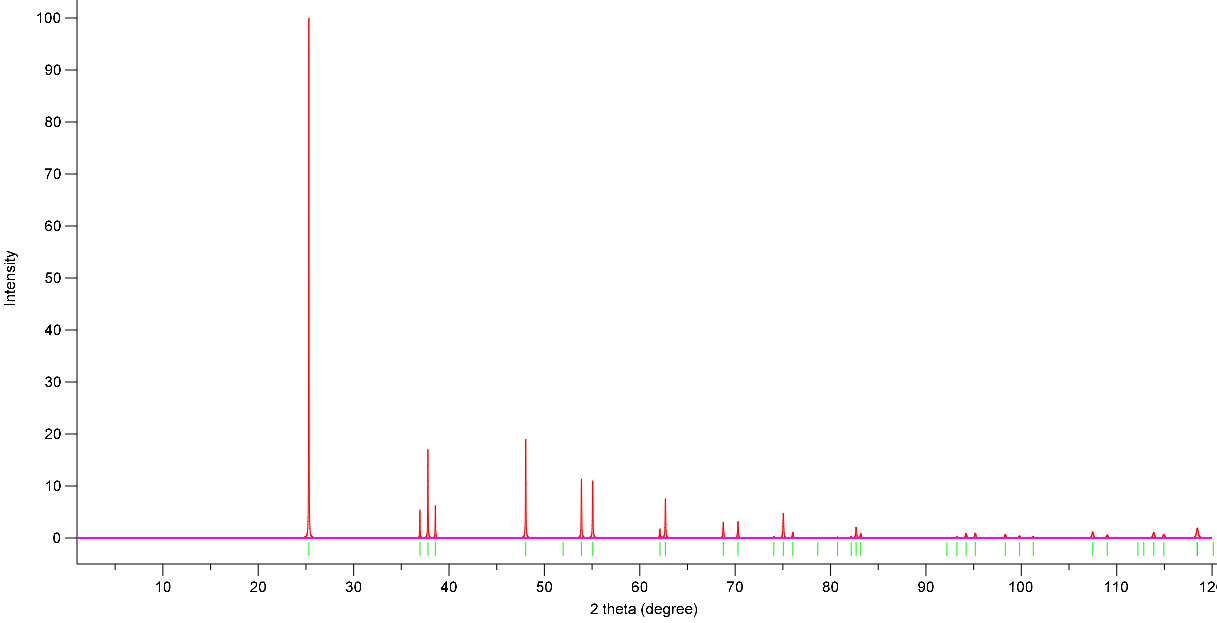
Simulated Powder XRD using VESTA:
X-Ray Wavelength: 1.54059 Angstrom
Simulation 1: GGA
Pseudopotential Used:
Ti.pbe-spn-rrkjus_psl.1.0.0.UPF
O.pbe-nl-rrkjus_psl.1.0.0.UPF
PP Type: Ultrasoft
Exchange Correlation Functional: PBE-GGA
Non-linear core corrections are used.
Total Energy vs Cutoff:
E-Cutoff(Ry) Total E(Ry)
10 -674.97884493
15 -720.42529095
20 -733.86047790
25 -738.17214180
30 -739.43060835
35 -739.70149419
40 -739.75957365
45 -739.77545989
50 -739.78366106
54 -739.78915969
55 -739.79040617
56 -739.79157928
60 -739.79553659
62 -739.79708585
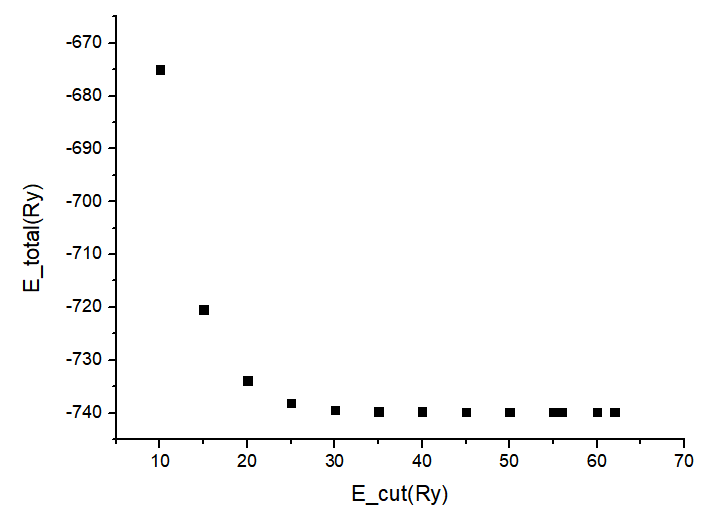
Wavefunction Energy Cutoff: 54 Ry
Charge Density Energy Cutoff: 600 Ry
k – mesh: 8x8x8
Run Type: GGA-PBE
Optimized Coordinates and Lattice Parameters:
Lattice Parameters: a= b= 3.80034 A, c= 9.70793 A
alpha=beta=gamma=90 degrees
ATOMIC_POSITIONS {angstrom}
Ti 0.000000 0.000000 0.000000
Ti 1.900170 1.900170 4.853964
Ti 0.000000 1.900170 2.426988
Ti 1.900170 0.000000 7.280940
O 0.000000 0.000000 2.005006
O 1.900170 1.900170 6.858963
O 0.000000 1.900170 4.431988
O 1.900170 0.000000 9.285942
O 1.900170 1.900170 2.848965
O 0.000000 0.000000 7.702922
O 1.900170 0.000000 5.275940
O 0.000000 1.900170 0.421986
Bandstructure:
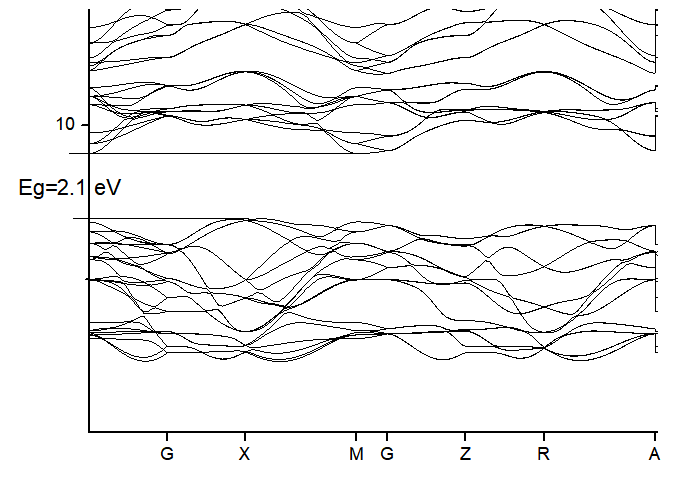
High Symmetry points: G-X-M-G-Z-R-A-Z (Brillouin Zone integration along these points)
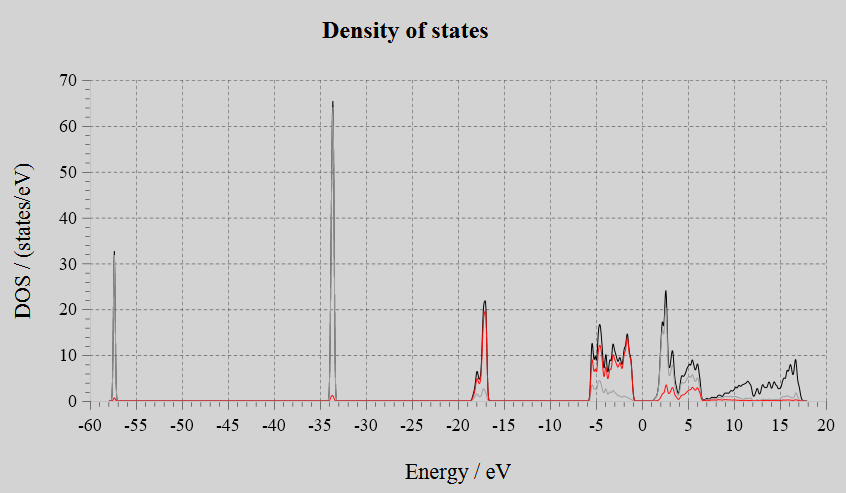
Density of States(DOS):
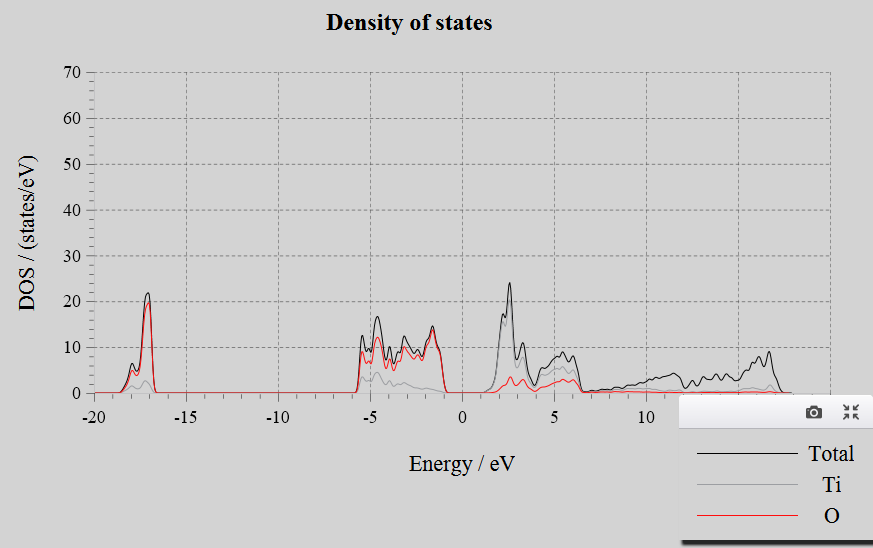
Input Files:
Simulation 2: GGA + U(Hubbard Correction)
The Hubbard parameter provides on-site Coulomb corrections to the highly localized electrons.
It can usually be determined by the linear response approach.
Variation of Band Gap with Hubbard Parameter U:
using simplified version of Cococcioni and de Gironcoli, PRB 71, 035105 (2005), using Hubbard_U
U(eV) Band-Gap(eV)
1 2.2182
2 2.2974
3 2.3862
4 2.4892
5 2.6094
6 2.7540
7 2.9287
8 3.1443
9 3.4117
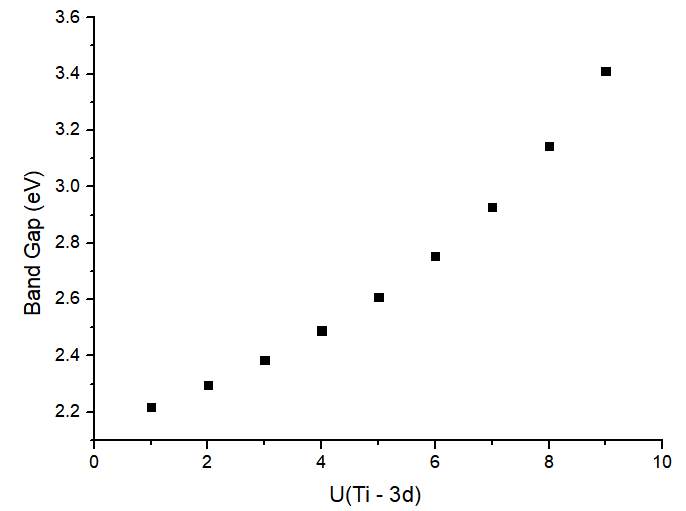
Therefore, the rest of the calculations will be run using U=8eV:
(NOTE: Just because U=8eV provided a good picture of the band-gap doesn’t mean that it will provide a good picture for all other properties. Such a high correction can change other properties and therefore, the parameter should be suitably determined. For more info read the article attached in the References section of this article.)
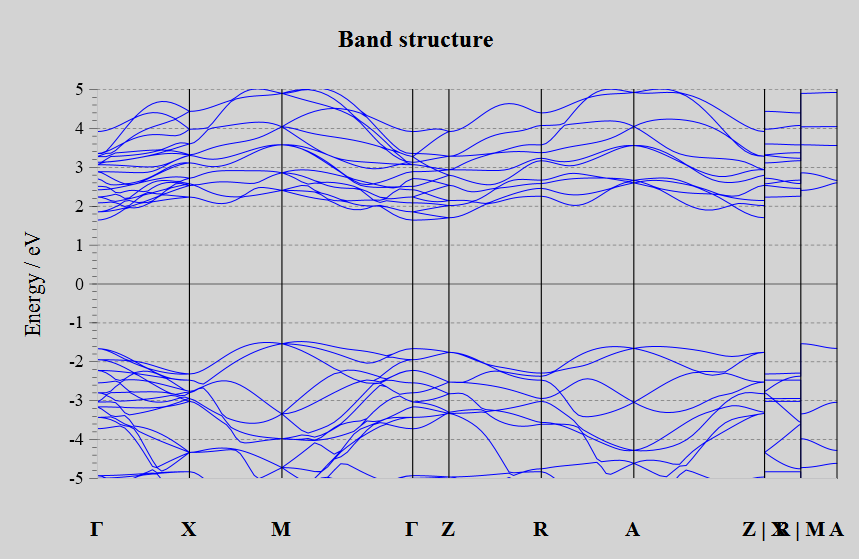
Bandstructure:
Density of States(DOS):
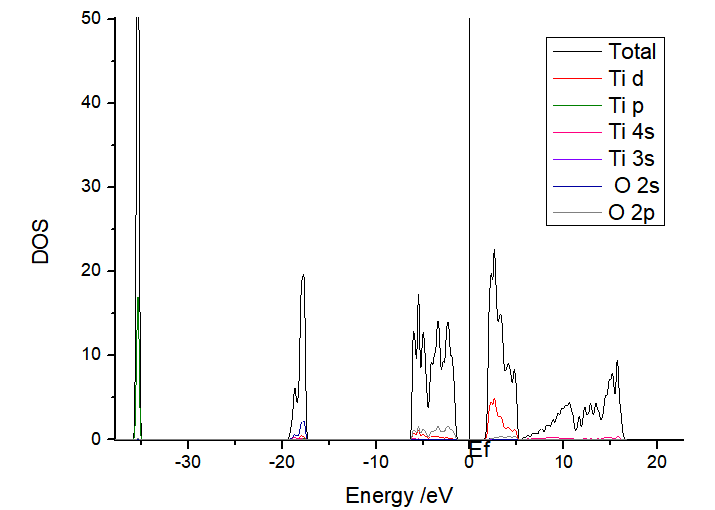
Input Files:
Acknowledgements:
I acknowledge the use of the following tools and packages in order to produce the above simulations.
Quantum Espresso(for DFT based simulations): http://www.quantum-espresso.org/
BURAI(for visualization and as a GUI for QE): http://nisihara.wixsite.com/burai
VESTA(for visualization and XRD simulations): http://jp-minerals.org/vesta/en/
References and Resources:
I’m a physicist specializing in computational material science with a PhD in Physics from Friedrich-Schiller University Jena, Germany. I write efficient codes for simulating light-matter interactions at atomic scales. I like to develop Physics, DFT, and Machine Learning related apps and software from time to time. Can code in most of the popular languages. I like to share my knowledge in Physics and applications using this Blog and a YouTube channel.