
Gnuplot is a portable command-line driven graphing utility for Linux and other OS.
C and Gnuplot can be used to plot complex functions.
One can write the function in C and then write the values of the function at various values in a txt file, which can then be plotted using Gnuplot.
The txt file should have numerical values in at least two columns. The first column is for x values. The rest of the columns are for y-axis values.
Following are some of the exercises to help you understand the process in a better way.
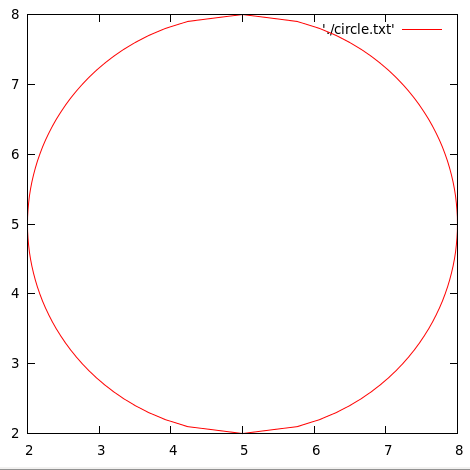
Plot a circle of a given radius and center using C and Gnuplot.
A. We can do this by writing a C program that calculates the x and y-values of the required circle and then write those values in a txt file. Then we can plot the file using Gnuplot.
Program:
/*************************************
 ***********PLOT A CIRCLE ************
 ************************************/
#include<stdio.h>
#include<math.h>
main(){
  FILE *fp=NULL;
  fp=fopen("circle.txt","w");
  double r;
  double x,y,x0,y0;
  printf("Enter the radius of the circle to be plotted: ");
  scanf("%lf",&r);
  printf("Enter the x and y-coordinates of the center: ");
  scanf("%lf%lf",&x0,&y0);
  for(y=y0-r;y<=y0+r;y=y+0.1){
    x=sqrt(r*r-(y-y0)*(y-y0))+x0;
    fprintf(fp,"%lf\t %lf\n",x,y);
  }
  for(y=y0+r;y>=y0-r;y=y-0.1){
    x=-sqrt(r*r-(y-y0)*(y-y0))+x0;
    fprintf(fp,"%lf\t %lf\n",x,y);

  }
}
The above program will generate a txt file(circle.txt) with the x and y-values for the circle of required radius and center coordinates.
Then the plotting can be done using Gnuplot by using the following command:
plot 'circle.txt' w l
OUTPUT:
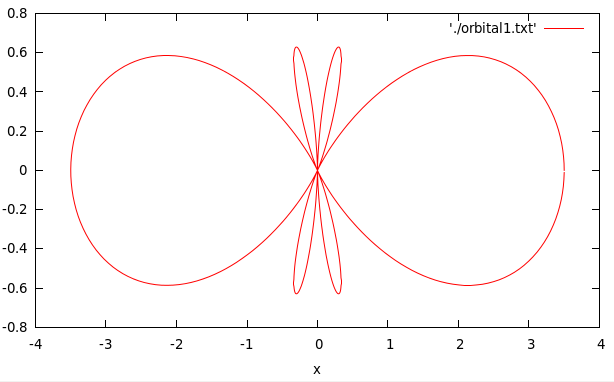
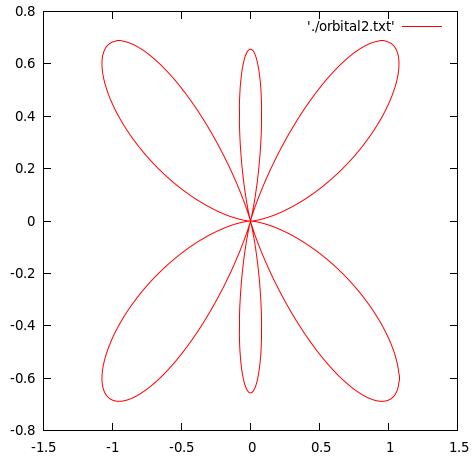
Plot  , the square modulus of the orbital wave function for
  . The values of are given by


Solution:
PROGRAM:
/**************************************
******PLOT ORBITAL WAVEFUNCTIONS******
*************************************/
#include<stdio.h>
#include<math.h>
double theta30(double x){
double out=3.0*sqrt(14.0)/4.0*(5.0/3.0*pow(cos(x),3)-cos(x));
return out;
}
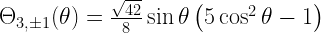
double theta31(double x){
double out=(sqrt(42))/(8)*sin(x)*(5*pow(cos(x),2)-1);
return out;
}
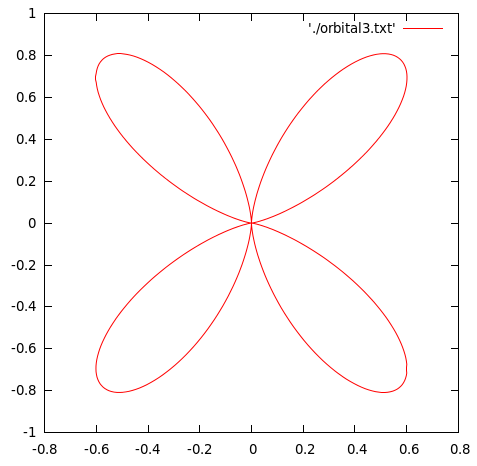
double theta32(double x){
double out=sqrt(105)/4*pow(sin(x),2)*cos(x);
return out;
}
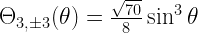
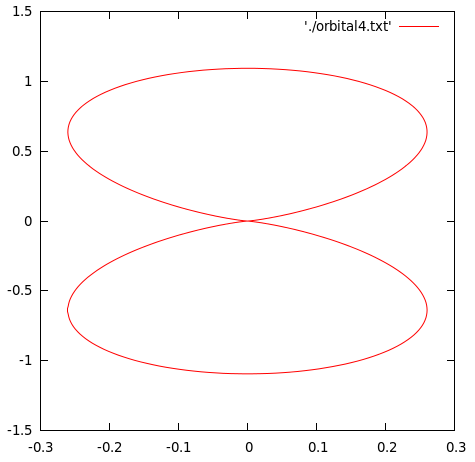
double theta33(double x){
double out=(sqrt(70))/(8)*(pow(sin(x),3));
return out;
}
main(){
double theta;
double x1,x2,x3,x4,y1,y2,y3,y4;
FILE *fp1=NULL;
FILE *fp2=NULL;
FILE *fp3=NULL;
FILE *fp4=NULL;
fp1=fopen("orbital1.txt","w");
fp2=fopen("orbital2.txt","w");
fp3=fopen("orbital3.txt","w");
fp4=fopen("orbital4.txt","w");
for(theta=0;theta<=2*M_PI;theta=theta+0.01){
x1=theta30(theta)*theta30(theta)*cos(theta);
x2=theta31(theta)*theta31(theta)*cos(theta);
x3=theta32(theta)*theta32(theta)*cos(theta);
x4=theta33(theta)*theta33(theta)*cos(theta);
y1=theta30(theta)*theta30(theta)*sin(theta);
y2=theta31(theta)*theta31(theta)*sin(theta);
y3=theta32(theta)*theta32(theta)*sin(theta);
y4=theta33(theta)*theta33(theta)*sin(theta);
fprintf(fp1,"%lf\t%lf\n",x1,y1);
fprintf(fp2,"%lf\t%lf\n",x2,y2);
fprintf(fp3,"%lf\t%lf\n",x3,y3);
fprintf(fp4,"%lf\t%lf\n",x4,y4);
}
}
The above program would generate for txt files containing the data-points for the four orbital equations(orbital1.txt,orbital2.tx,….). These can then be plotted using Gnuplot by using the following command:
plot 'orbital1.txt' w l
OUTPUT:
REFERENCES:
The above problems have been taken from the Computer Programming & Numerical Analysis Manual by Dr. Shobhit Mahajan.
I’m a physicist specializing in computational material science with a PhD in Physics from Friedrich-Schiller University Jena, Germany. I write efficient codes for simulating light-matter interactions at atomic scales. I like to develop Physics, DFT, and Machine Learning related apps and software from time to time. Can code in most of the popular languages. I like to share my knowledge in Physics and applications using this Blog and a YouTube channel.
Do you have anything related to finding the Jump Discontinuities of a plot in C programming.