
In this post I will show you how to calculate and plot the Lissajous Curves using C and Gnuplot.
We will use the following information:
We will create a program that calculates the values of the x and y for various 
We will create two functions called ‘x’ and ‘y’, that contain the definition of x and y respectively.


PROGRAM:
/************************************
********LISSAJOUS FIGURES **********
************************************/
#include<stdio.h>
#include<math.h>
double x(double theta){
	return sin(theta);
}
double y(double theta, double A,double n, double delta){
	return A*sin(n*theta+delta);
}
main(){
	double theta;
	FILE *fp=NULL;
	double A,n,delta;
	fp=fopen("lissajous.txt","w");
	/*Loop to calculate and store data-points*/
	for(theta=0;theta<=4*M_PI;theta=theta+0.01){
		/*Change A, n or delta here*/
		A=1;
		n=3;
		delta=M_PI/4;
		fprintf(fp,"%lf\t%lf\n",x(theta),y(theta,A,n,delta));
	}
}
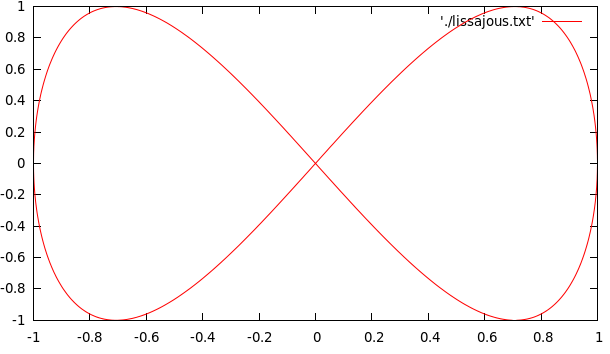
When you run the above C, it will generate a file called ‘lissajous.txt’ which would contain 2 columns of data-points.
The first column contains the ‘x’ values and the next one is for ‘y’ values.
These can be easily plotted using Gnuplot by using the following commands:
GnuPlot Command
plot 'lissajous.txt' w l
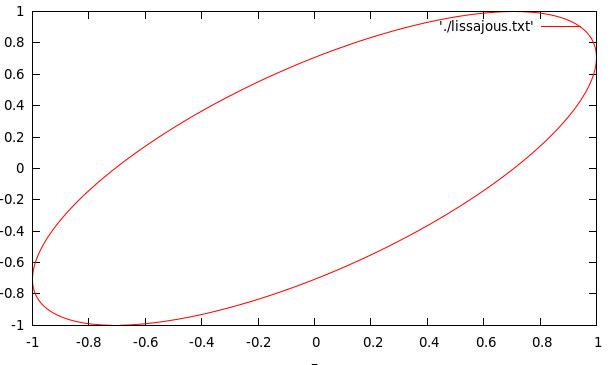
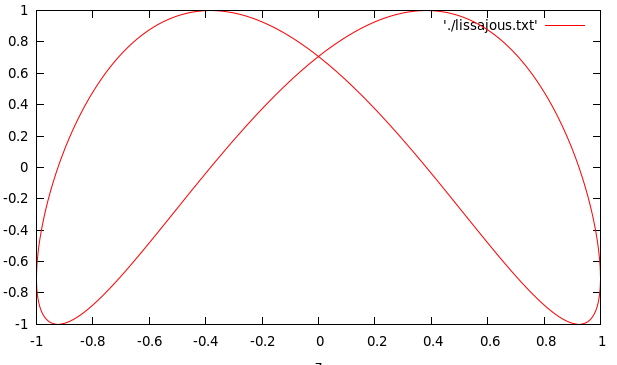
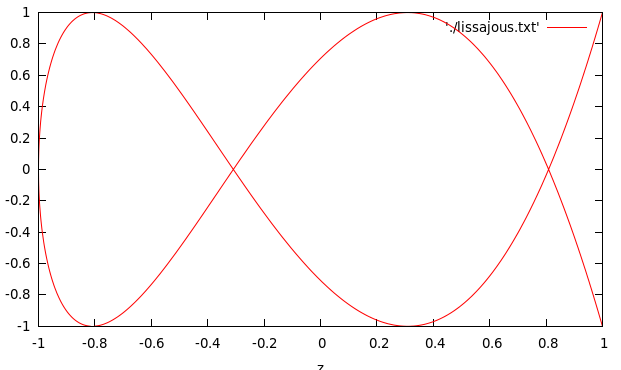
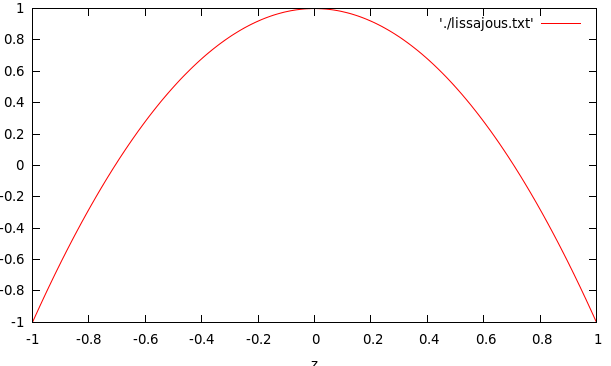
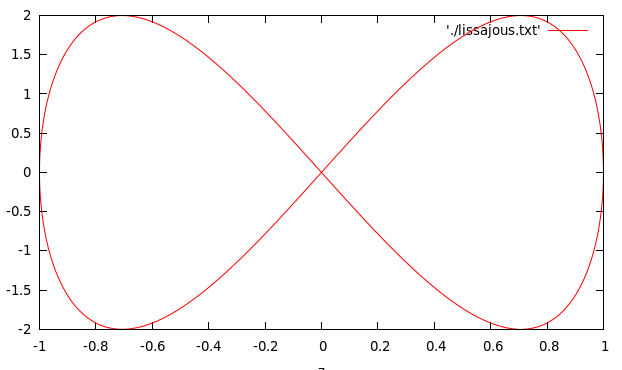
OUTPUT
For different values of 






Resources:
https://academo.org/demos/lissajous-curves/

I’m a physicist specializing in computational material science with a PhD in Physics from Friedrich-Schiller University Jena, Germany. I write efficient codes for simulating light-matter interactions at atomic scales. I like to develop Physics, DFT, and Machine Learning related apps and software from time to time. Can code in most of the popular languages. I like to share my knowledge in Physics and applications using this Blog and a YouTube channel.