
In this post you will find a simple Python program that finds the root of a function using the Bisection Method as well as a Python code that shows the Bisection Method in action using Matplotlib and animations.
Bisection Method Python Program
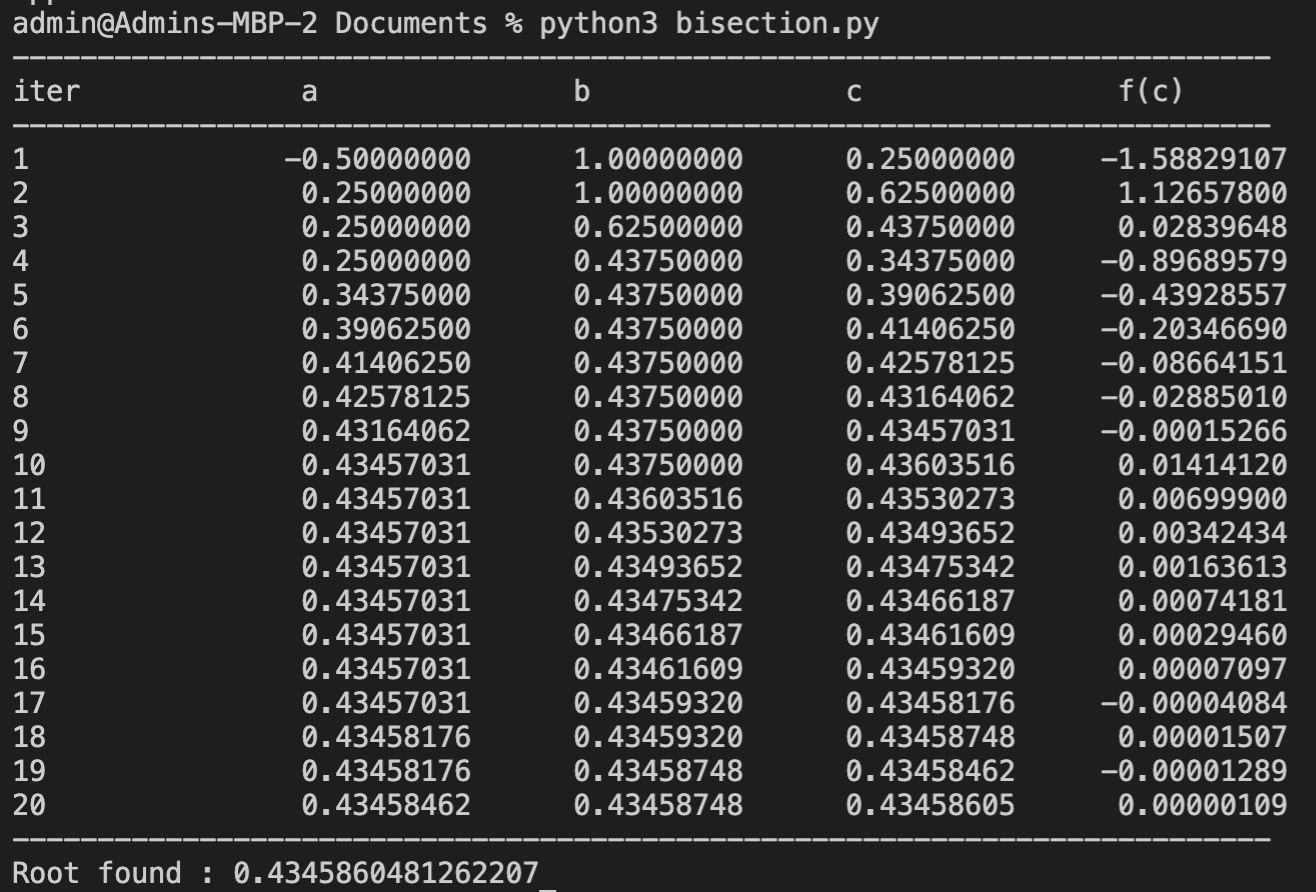
# Author: Manas Sharma
# Website: www.bragitoff.com
# Email: [email protected]
# License: MIT
# BISECTION METHOD

import numpy as np
import matplotlib.pyplot as plt


# Define the function whose roots are required
def f(x):
    #return x**3-8
    return x*np.exp(x)-np.sin(8*x)-1

maxiter = 50 # Max. number of iterations
eps = 10E-6  # Acceptable Error (termination criteria)
a = -0.5        # Guess Value for the lower bound on the root
b = 1        # Guess Value for the upper bound on the root

# Check if these values bracket the root or not?
if f(a)*f(b)>0:
    print('The given guesses do not bracket the root.')
    exit()

# Print the table header
print('--------------------------------------------------------------------------')
print('iter \t\t a \t\t b \t\t c \t\t f(c)        ')
print('--------------------------------------------------------------------------')

# Begin iterations for bisection method
for i in range(maxiter):
    # Calculate the value of the root at the ith step
    c = (a+b)/2

    # Print some values for the table
    print(str(i+1)+'\t\t% 10.8f\t% 10.8f\t% 10.8f\t% 10.8f\t' %(a, b, c, f(c)))

    # Check if the root has been found with acceptable error or not?
    if np.abs(f(c))<eps:
        print('--------------------------------------------------------------------------')
        print('Root found : '+str(c))
        exit()
    # Check whether the root lies between a and c
    if f(a)*f(c)<0:
        # Change the upper bound
        b = c
    else: # The root lies between c and b
        # Change the lower bound
        a = c


print('--------------------------------------------------------------------------')
if i==maxiter-1:
    print('\n\nMax iterations reached!')
    print('Approximaiton to the Root after max iterations is : '+str(c))
OUTPUT
Bisection Method Animation using Python
The animations are basically achieved using Matplotlib and a the pause feature thereof. Therefore, you will see a lot of pause statements and sequential programming.
# Author: Manas Sharma
# Website: www.bragitoff.com
# Email: [email protected]
# License: MIT
# Bisection Method animation using Matplotlib

import numpy as np
import matplotlib.pyplot as plt
# from matplotlib.pyplot import figure
from matplotlib.pyplot import *

fig = figure(figsize=(8, 8), dpi=120)


# Define the function whose roots are required
def f(x):
    #return x**3-8
    return x*np.exp(x)-np.sin(8*x)-1

# INPUT PARAMETERS------------------------
maxiter = 50 # Max. number of iterations
eps = 1E-4  # Acceptable Error (termination criteria)
a = -0.5        # Guess Value for the lower bound on the root
b = 10        # Guess Value for the upper bound on the root

# Plot the given function
x = np.arange(a-0.5,b+0.5,0.00001)
y = f(x)
plt.plot(x,y, linewidth=3)
plt.axhline(y=0, c='black',linewidth=1)


# Check if these values bracket the root or not?
if f(a)*f(b)>0:
    print('The given guesses do not bracket the root.')
    exit()

# Print the table header
print('--------------------------------------------------------------------------')
print('iter \t a \t\t b \t\t c \t\t f(c)        ')
print('--------------------------------------------------------------------------')

# Begin iterations for bisection method
for i in range(maxiter):
    # Calculate the value of the root at the ith step
    c = (a+b)/2

    # Plot the important points and annotate them on the graph
    # Title
    plt.title(r"$\bf{ITERATION} $ #"+str(i+1)+'\n\na = % 10.8f;       b = % 10.8f;      c = ?;       f(c) = ?'%(a, b))
    plt.xlabel('x')
    plt.ylabel('y')
    plt.rcParams.update({'font.size': 16})

    ax = plt.gca() # grab the current axis

    # Create a secondary axis for marking the a,b and c points
    secax = ax.secondary_xaxis('top')
    labels2 = [item.get_text() for item in secax.get_xticklabels()]
    ticks = plt.xticks()[0]
    labels2=['a','b']
    secax.set_xticks( [a,b])
    secax.set_xticklabels(labels2)
    plt.scatter(a,f(a),c='blue',s=250,alpha=0.5)
    plt.scatter(b,f(b),c='blue',s=250,alpha=0.5)
    # plt.annotate('a',[a,0])
    plt.annotate('f(a)',[a,f(a)])
    # plt.annotate('b',[b,0])
    plt.annotate('f(b)',[b,f(b)])
    # plt.annotate('c=(a+b)/2',[c,0])
    plt.axvline(x=a, c='blue',linewidth=2,alpha=0.5)
    plt.axvline(x=b, c='blue',linewidth=2,alpha=0.5)


    plt.pause(1.0)
    plt.rcParams.update({'font.size': 10})
    plt.title(r"$\bf{ITERATION} $ #"+str(i+1)+'\n\na = % 10.8f;       b = % 10.8f;      c = % 10.8f;       f(c) = % 10.8f'%(a, b, c, f(c)))
    plt.rcParams.update({'font.size': 16})
    plt.annotate('f(c)',[c,f(c)])
    labels2 = [item.get_text() for item in secax.get_xticklabels()]
    ticks = plt.xticks()[0]
    labels2=['a','b','c=(a+b)/2']
    secax.set_xticks( [a,b,c])
    secax.set_xticklabels(labels2)
    # --------
    # The follwoing stuff is for changing some axis ticks and their labels
    # ax = plt.gca() # grab the current axis
    # Get axis labels
    #labels = [item.get_text() for item in ax.get_xticklabels()]
    #Debug
    # print(labels)
    # Get x axis ticks
    #ticks = plt.xticks()[0]
    # Debug
    # print(ticks)
    # Change the labels for a,b and c point
    #plt.xticks(list(ticks) + [a,b,c])
    #labels.append('a')
    #labels.append('b')
    #labels.append('c')
    #ax.set_xticklabels(labels)
    #-----------------------------------------------------


    plt.scatter(c,f(c),c='red',s=250,alpha=0.5)

    plt.axvline(x=c, c='red',linewidth=2,alpha=0.5)
    plt.autoscale()

    # Print some values for the table
    print(str(i+1)+'\t% 10.8f\t% 10.8f\t% 10.8f\t% 10.8f\t' %(a, b, c, f(c)))

    plt.pause(1.0)
    # Check whether the root lies between a and c
    if f(a)*f(c)<0:
        # Change the upper bound
        text = plt.text(0.5, 0.2, 'f(a).f(c)<0\n\nmake b=c', fontsize=16,horizontalalignment='center',verticalalignment='center',transform = ax.transAxes)
        # Change opacity of the text box
        text.set_bbox(dict(facecolor='whitesmoke', alpha=0.5, edgecolor='whitesmoke'))
        plt.scatter(a,f(a),c='yellow',s=175,alpha=1)
        plt.scatter(c,f(c),c='yellow',s=175,alpha=1)
        plt.pause(1)
        b = c
    else: # The root lies between c and b
        # Change the lower bound
        a = c
        text = plt.text(0.5, 0.2, 'f(c).f(b)<0\n\nmake a=c', fontsize=16,horizontalalignment='center',verticalalignment='center',transform = ax.transAxes)
        # Change opacity of the text box
        text.set_bbox(dict(facecolor='whitesmoke', alpha=0.5, edgecolor='whitesmoke'))
        plt.scatter(b,f(b),c='yellow',s=175,alpha=1.0)
        plt.scatter(c,f(c),c='yellow',s=175,alpha=1)
        plt.pause(1)

    plt.pause(2.0)
    # Check if the root has been found with acceptable error or not?
    if np.abs(f(c))<eps:
        print('--------------------------------------------------------------------------')
        print('! Root found approximately!: '+str(c))
        text = plt.text(0.5, 0.5, 'Root found within acceptable error \nlimits as specified by the user.\n\n|f(c)|<'+str(eps)+'\n\nRoot ≈'+str(np.round(c,7)), fontsize=16,horizontalalignment='center',verticalalignment='center',transform = ax.transAxes)
        # Change opacity of the text box
        text.set_bbox(dict(facecolor='papayawhip', alpha=0.6, edgecolor='papayawhip'))
        plt.pause(5.0)
        break
    plt.clf()
    x = np.arange(a-(b-a)/2,b+(b-a)/2,0.00001)
    y = f(x)
    plt.rcParams.update({'font.size': 10})
    plt.plot(x,y, linewidth=3)
    plt.axhline(y=0, c='black',linewidth=1)
    # plt.xlim(a-(b-a),b+(b-a))


plt.show()
print('--------------------------------------------------------------------------')
if i==maxiter-1:
    print('\n\nMax iterations reached!')
    print('Approximaiton to the Root after max iterations is : '+str(c))
OUTPUT
I’m a physicist specializing in computational material science with a PhD in Physics from Friedrich-Schiller University Jena, Germany. I write efficient codes for simulating light-matter interactions at atomic scales. I like to develop Physics, DFT, and Machine Learning related apps and software from time to time. Can code in most of the popular languages. I like to share my knowledge in Physics and applications using this Blog and a YouTube channel.