

In this post we will write a C program to calculate the Bessel Functions of the first kind.
We will use the series representation of Bessel functions, and use the concept of previous posts to calculate the sum of infinite series, and thus find the values.
The series is given as:
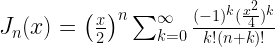
As you can notice, we would need to calculate factorials for the series sum evaluation.
We already wrote a program for that here.
So we will just use the function to calculate and return the factorial.
If you haven’t already checked out my past posts on Series Summation then you can read the following articles, before you move on with this post.
Sine Series(Finite) – C Program
Sine Series(Infinite) – C Program
Cosine Series(Infinite) – C Program
If we remove the 

So we can simply calculate the sum of this series and then multiply the result by
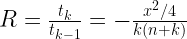
The first term of the new series is:

and the ratio of consecutive terms is:
Note: k starts from 1 for our ratio to work.
Now, that you have the above information, the Bessel Function for a given value of 
PROGRAM:
/*****************************
 ******BESSEL FUNCTION********
 ***********SERIES************
 ****************************/
#include<stdio.h>
#include<math.h>
double factorial(int n){
  int i;
  double fact=1;
  for(i=n;i>=1;i--){
    fact=fact*i;
  }
  return fact;
}
main(){
	FILE *fp=NULL;
	fp=fopen("besselSeriesPlotn0.txt","w");
	double t0,t1,R,sum,x,eps;
	int n;
	printf("Enter the value of n: ");
	scanf("%d",&n);
	printf("Enter the desired accuracy: ");
	scanf("%lf",&eps);
	for(x=0;x<=10;x=x+0.1){
		int k=1;
		//Initialize First Term
		t0=1/factorial(n);
		//Make sum equal to the first term
		sum=t0;
		do{
			//Find the ratio of the second term to the first term using already known relation
			R=-(x*x/4)/(k*(n+k));
			//Calculate the second term
			t1=R*t0;
			//find the new sum
			sum=sum+t1;
			t0=t1;
			k++;
			//keep on summing terms until the required accuracy is reached
		}while(fabs(t1/sum)>eps);
		sum=sum*pow(x/2,n);
		fprintf(fp,"%lf\t%lf\n",x,sum);
	}

}
The above program will prompt the user to enter the value of 'besselSeriesPlotn0.txt'.
Then this file can be plotted using Gnuplot command:
->plot 'besselSeriesPlotn0.txt' w l
Programmer, can change the name of the file to be written for different values of
OUTPUT:
The following are the output results for a few sample runs of the program:
for n=0:
![]()
Gnuplot Output:

for n=1:
![]()
Gnuplot Output:

for n=2:

Gnuplot Output:

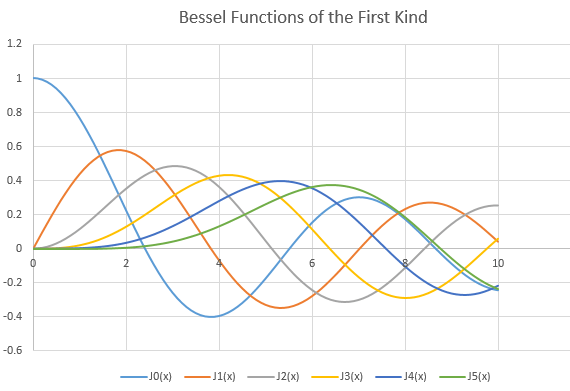
In the following image, I have plotted many Bessel functions simultaneously, by compiling the outputs for different
Hope, you found this post helpful.
If you have any questions/doubts leave a comment down below.
Related:
Sine Series(Finite) – C Program
Sine Series(Infinite) – C Program
Cosine Series(Infinite) – C Program
Problems on Series Sum – C
References:
http://mathworld.wolfram.com/BesselFunctionoftheFirstKind.html
https://en.wikipedia.org/wiki/Bessel_function
Ph.D. researcher at Friedrich-Schiller University Jena, Germany. I’m a physicist specializing in computational material science. I write efficient codes for simulating light-matter interactions at atomic scales. I like to develop Physics, DFT, and Machine Learning related apps and software from time to time. Can code in most of the popular languages. I like to share my knowledge in Physics and applications using this Blog and a YouTube channel.
what’s the command to plot using different colors??
btw,thankyou very much.was very helpful 😀
sir, I want to know about Inokutti-Hirayama model (IH) fitting for non-exponential curve.
Unfortunately, I’m not aware of it.
Hii, this code does not work for higher values ok x (> 500) if we increase x then J should converge but it goes to infinite instead, can you explain why?